Analysis
In this module we will:
-
Review and understand the concept of an Analysis
-
Deploy a BlueGreen Rollout with an Analysis
-
Perform a successful promotion of an image tested by an Analysis
-
Perform and observe a promotion that fails an Analysis
Analysis Overview
When performing upgrades of services there is a need to test the new version that is being deployed to ensure functionality is not being negatively impacted. The Analysis feature enables Rollouts to collect data and metrics from a variety of providers to validate the new version of the application.
In addition to collecting data, an Analysis can include a Job to drive more advanced use cases. For example, a Job could be used to run load against an application in order to generate the metrics needed to validate the revision.
To deploy an Analysis, first an AnalysisTemplate is created that defines the analysis that is required and then is associated with one or more rollouts. The way an analysis is associated with a rollout is dependent on the rollout strategy used. In this module we will look at it from the perspective of the Blue-Green strategy we have deployed previously. In the next module we will delve into using an Analysis with the Canary strategy as well.
In the blue-green strategy, an Analysis can be added as either pre-promotion or post-promotion. Pre-promotion is used before the new version is deployed and is useful for validating the deployment prior to cutting over to it for live traffic. Post-promotion is executed after the cut-over and can validate that the deployment is working with live traffic.
Analysis Deployment
In this section we will deploy the same Blue-Green rollout we did previously but with a pre-promotion analysis included along with the corresponding analysis template. Prior to starting, confirm you are still at the correct path.
cd ~/argo-rollouts-workshop/content/modules/ROOT/examples/Next, let’s explore the manifests that we will be deploying in the ./bluegreen-analysis/base folder:
ls ./bluegreen-analysis/baseHere you will see the same files that we used previously, however there is a new file analysistemplate.yaml. Examining
the file we see it appears as follows:
cat ./bluegreen-analysis/base/analysistemplate.yamlkind: AnalysisTemplate
apiVersion: argoproj.io/v1alpha1
metadata:
name: smoke-tests
spec:
args:
- name: namespace
- name: route-name
- name: route-url
- name: api-token
valueFrom:
secretKeyRef:
name: monitor-auth-secret
key: token
metrics:
- name: success-rate
interval: 30s
count: 4
successCondition: result[0] == 0
failureLimit: 0
provider:
prometheus:
address: https://thanos-querier.openshift-monitoring.svc.cluster.local:9091
timeout: 40
insecure: true
headers:
- key: Authorization
value: "Bearer {{args.api-token}}"
query: |
irate(haproxy_backend_http_responses_total{exported_namespace='{{args.namespace}}', route=~"{{args.route-name}}", code="5xx"}[1m]) > 5 or on() vector(0)
- name: run-load
provider:
job:
spec:
backoffLimit: 1
template:
spec:
containers:
- name: siege
image: quay.io/gnunn/tools:latest
command: [sh, -c]
args: ["siege -c 20 -r 15 -d10 -v http://{{args.route-url}}"]
restartPolicy: NeverThis AnalysisTemplate is broken up into two broad sections as follows:
-
.spec.args. This is where you can specify arguments which are passed by the rollout when using the template. These arguments enable the template to be reused across many different rollouts. -
.spec.metrics. These are the metric providers that will be used to collect data for the analysis as well as any jobs that need to be executed.
In the metrics provider section we can see that we have two providers defined. The first one, named success-rate, uses the prometheus metric provider to pull metrics from Thanos, an aggregator for Prometheus data. The second one, run-load is a job that runs Apache Siege
to drive some load on the application.
The count and interval fields in the success-rate metric powered by the prometheus provider indicate that the metric will be checked four times
with a thirty second interval between each check. The failureLimit determines how many failures are permitted for the rollout to be considered
a success. Here we set a failure limit of 0.
Finally, remember we are running this Analysis in the pre-promotion phase of the blue-green strategy so the application will not be receiving load from users, therefore generating load with Apache Siege will generate the metrics we need to determine whether to proceed with the promotion.
In the arguments we are taking three arguments, route-name, route-url and namespace, which will be passed from the
Rollout.
The route-name and namespace arguments are used in the prometheus metrics provider in the query field to specify
the specific route to fetch the status of the HTTP return codes. This query returns the increased rate of HTTP error codes (5xx)
over a 1 minute interval.
The route-url parameter is being used in the second provider, the job, where we will be creating load against the route. This
parameter is used to specify the OpenShift route URL where we want to drive the load, i.e the URL that
siege will be hitting when it generates load.
Finally a third parameter, api-token, is provided by a secret. This secret provides the token needed
to access the OpenShift monitoring stack. It was created by the GitOps process which provisioned this workshop.
Next let’s look at the rollout and see how the AnalysisTemplate is wired into the rollout.
cat ./bluegreen-analysis/base/rollout.yamlapiVersion: argoproj.io/v1alpha1
kind: Rollout
metadata:
name: rollouts-demo
spec:
replicas: 2
revisionHistoryLimit: 10
selector:
matchLabels:
app: rollouts-demo
strategy:
blueGreen:
activeService: active
previewService: preview
autoPromotionEnabled: true
prePromotionAnalysis:
args:
- name: namespace
valueFrom:
fieldRef:
fieldPath: metadata.namespace
- name: route-name
value: preview
- name: route-url
value: preview-%USER%-prod.%SUB_DOMAIN%
templates:
- templateName: smoke-tests
template:
metadata:
labels:
app: rollouts-demo
spec:
containers:
- image: quay.io/openshiftdemos/rollouts-demo:blue
imagePullPolicy: IfNotPresent
name: rollouts-demo
ports:
- containerPort: 8080Notice that in .spec.strategy.blueGreen we have now defined the prePromotionAnalysis field. In this field
we define the analysis template we want to use as well as the arguments that the rollout needs to provide the
template.
To deploy this new version of the blue-green rollout, execute the following command:
kustomize build ./bluegreen-analysis/base | sed "s/%SUB_DOMAIN%/OPENSHIFT_CLUSTER_INGRESS_DOMAIN_PLACEHOLDER/" | sed "s/%USER%/USER_PLACEHOLDER/" | oc apply -n USER_PLACEHOLDER-prod -f -Check that the rollout has deployed successfully in the Argo Rollouts Dashboard, The dashboard for our blue-green rollout will appear identically as follows:
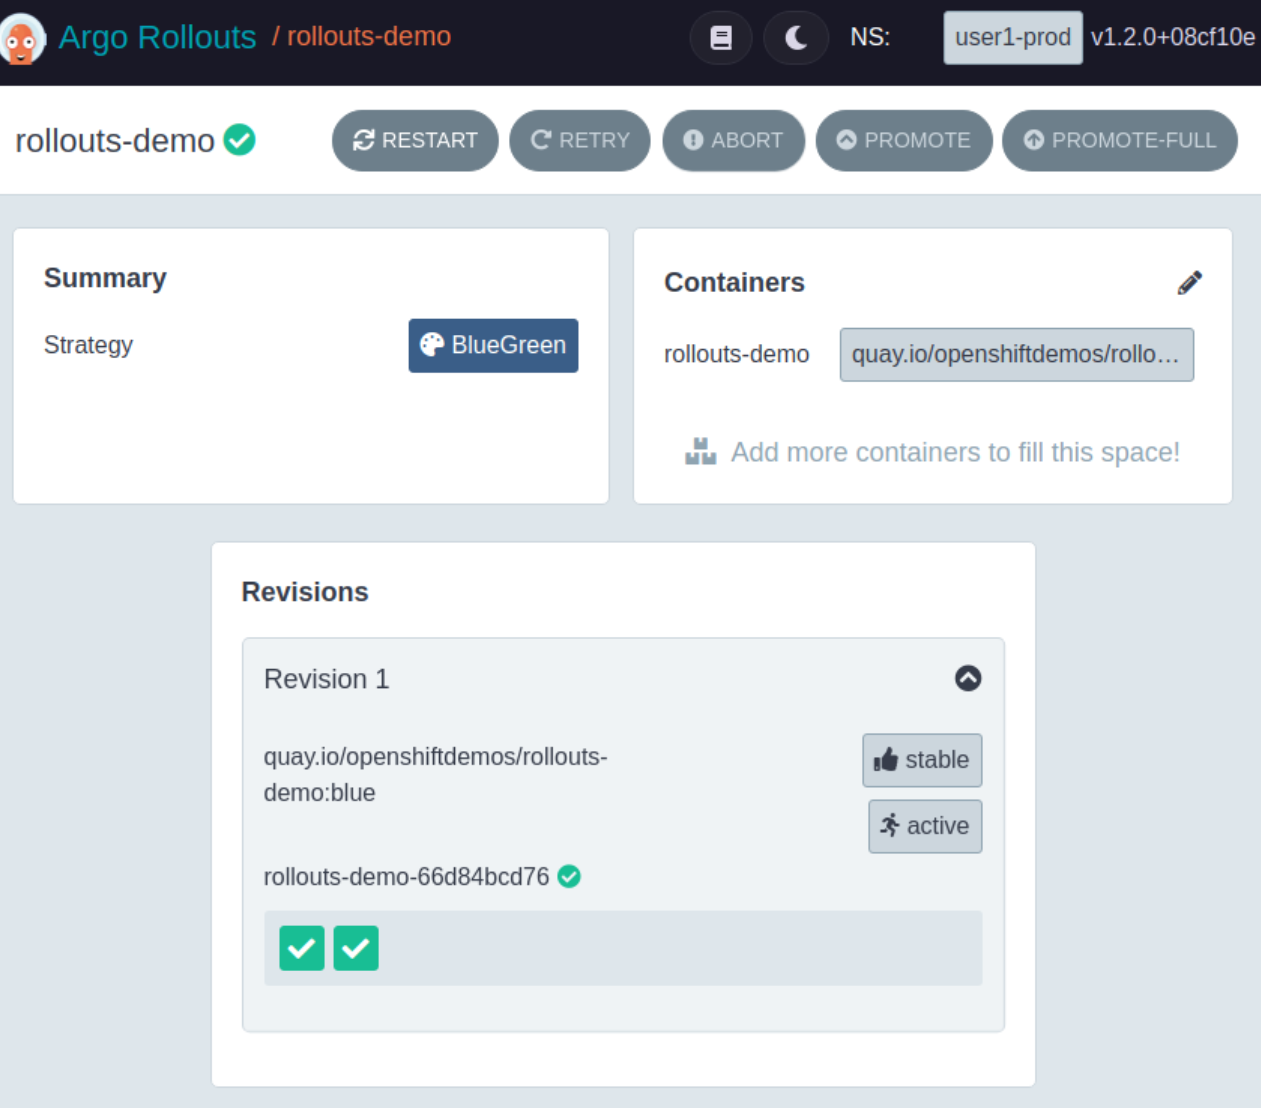
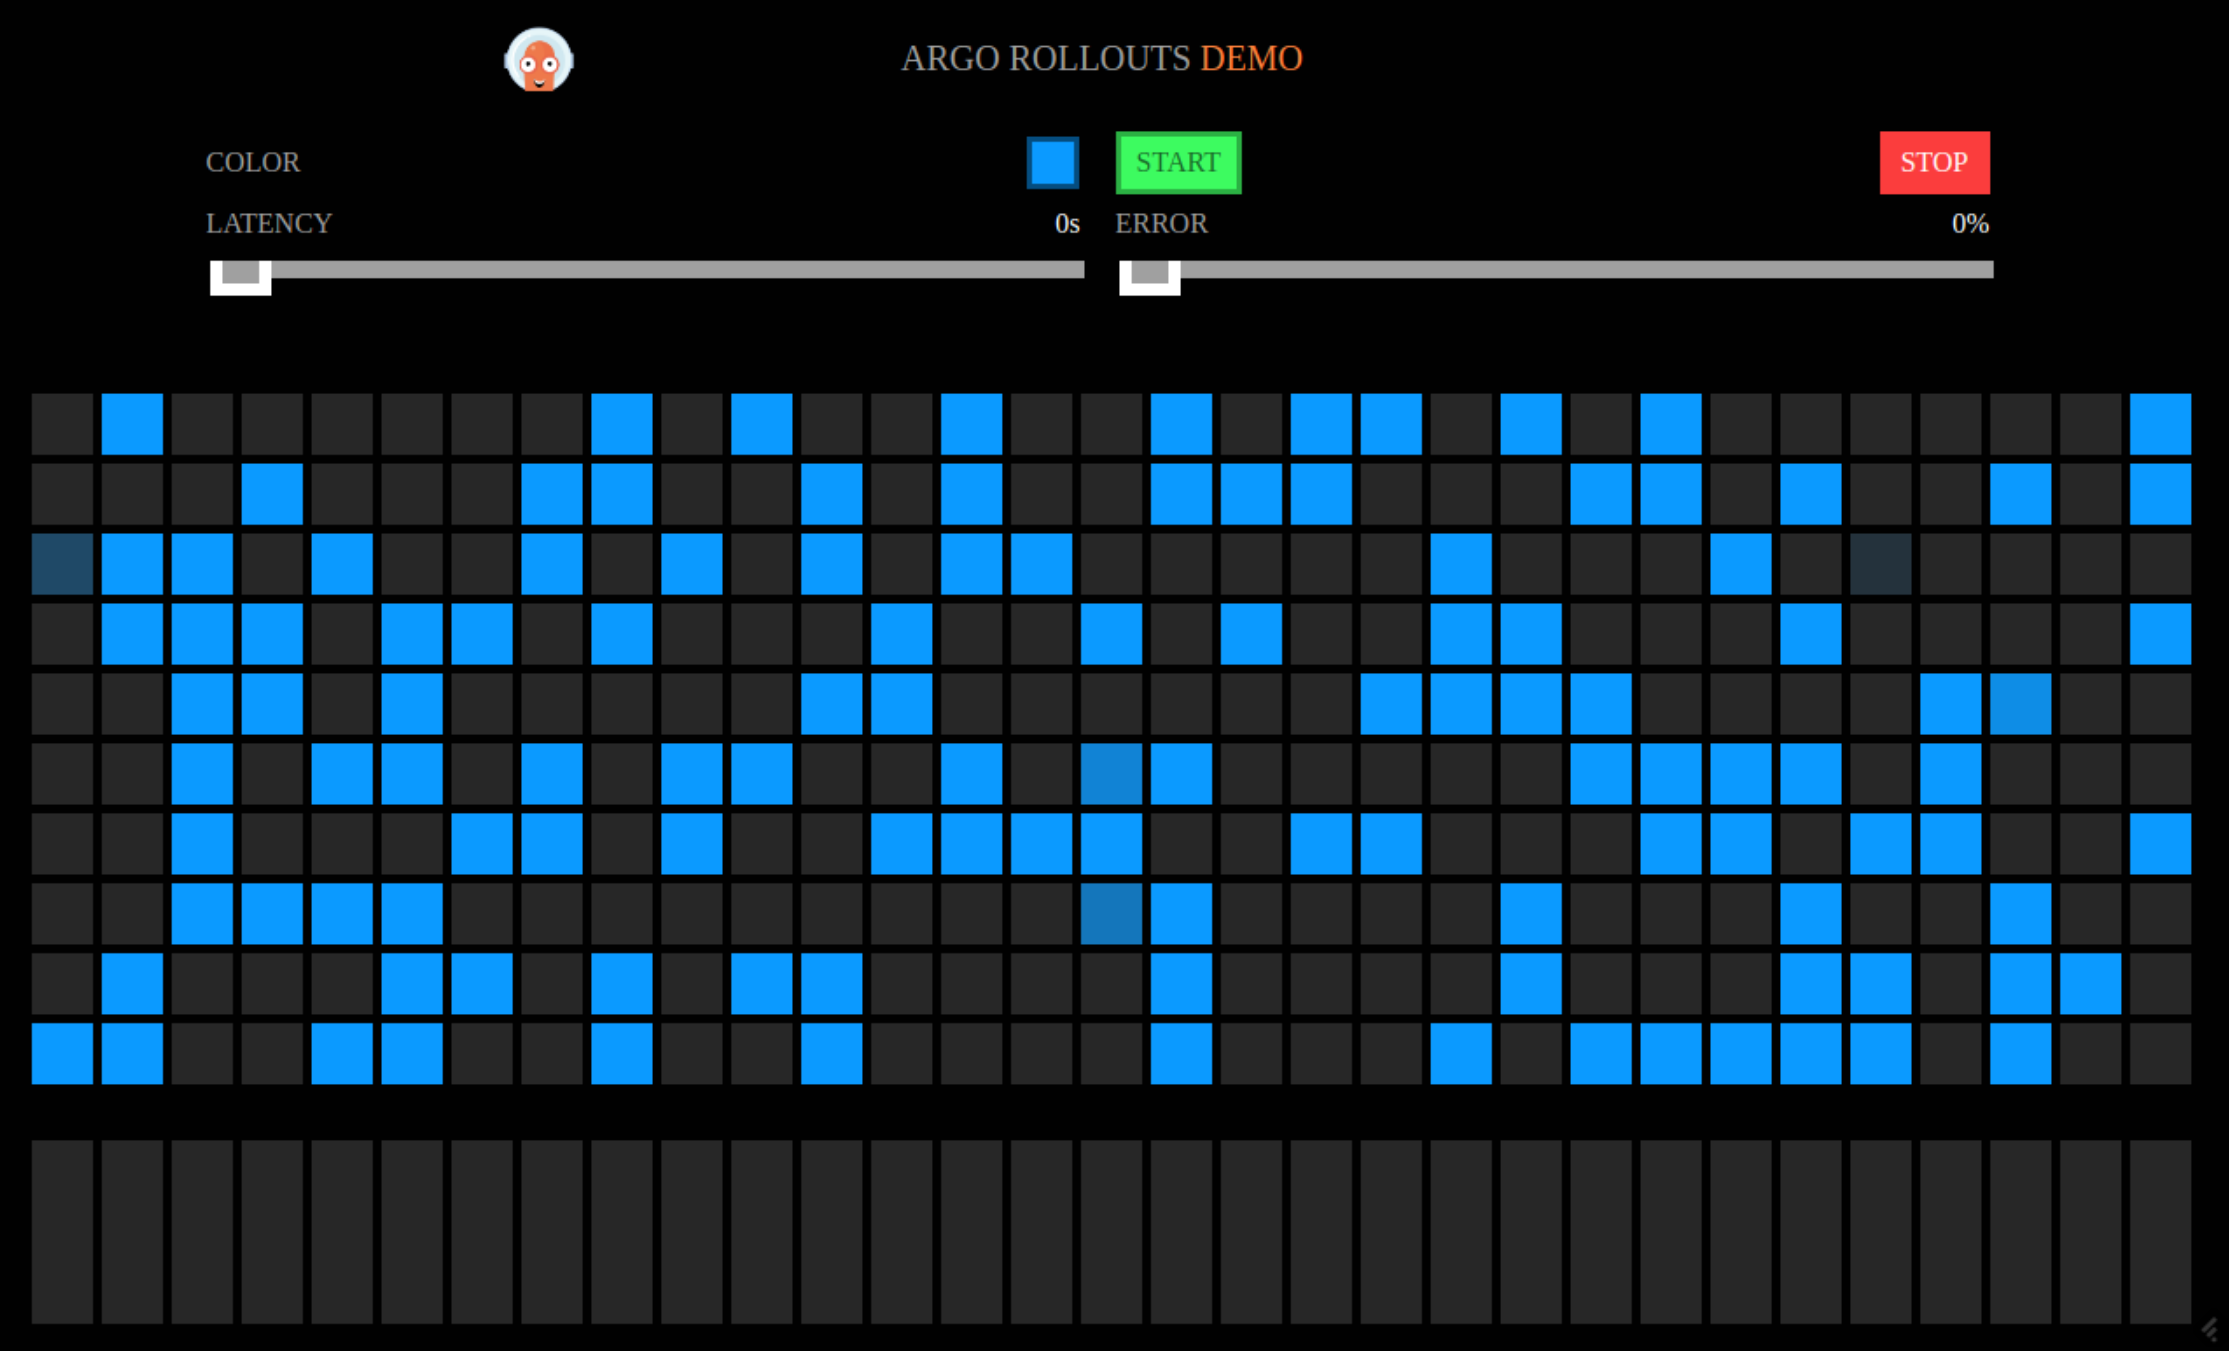
Confirm that the application is displaying blue squares by opening the active route in your browser:
Promotion with Analysis
In this section we will promote new images using the Analysis to test the new version of the application. In the first part we will perform a promotion where the analysis succeeds and the promotion occurs. In the second part we will have the application trigger errors causing the analysis to fail and the promotion to be aborted.
Note that auto-promotion is enabled.
Analysis Passes
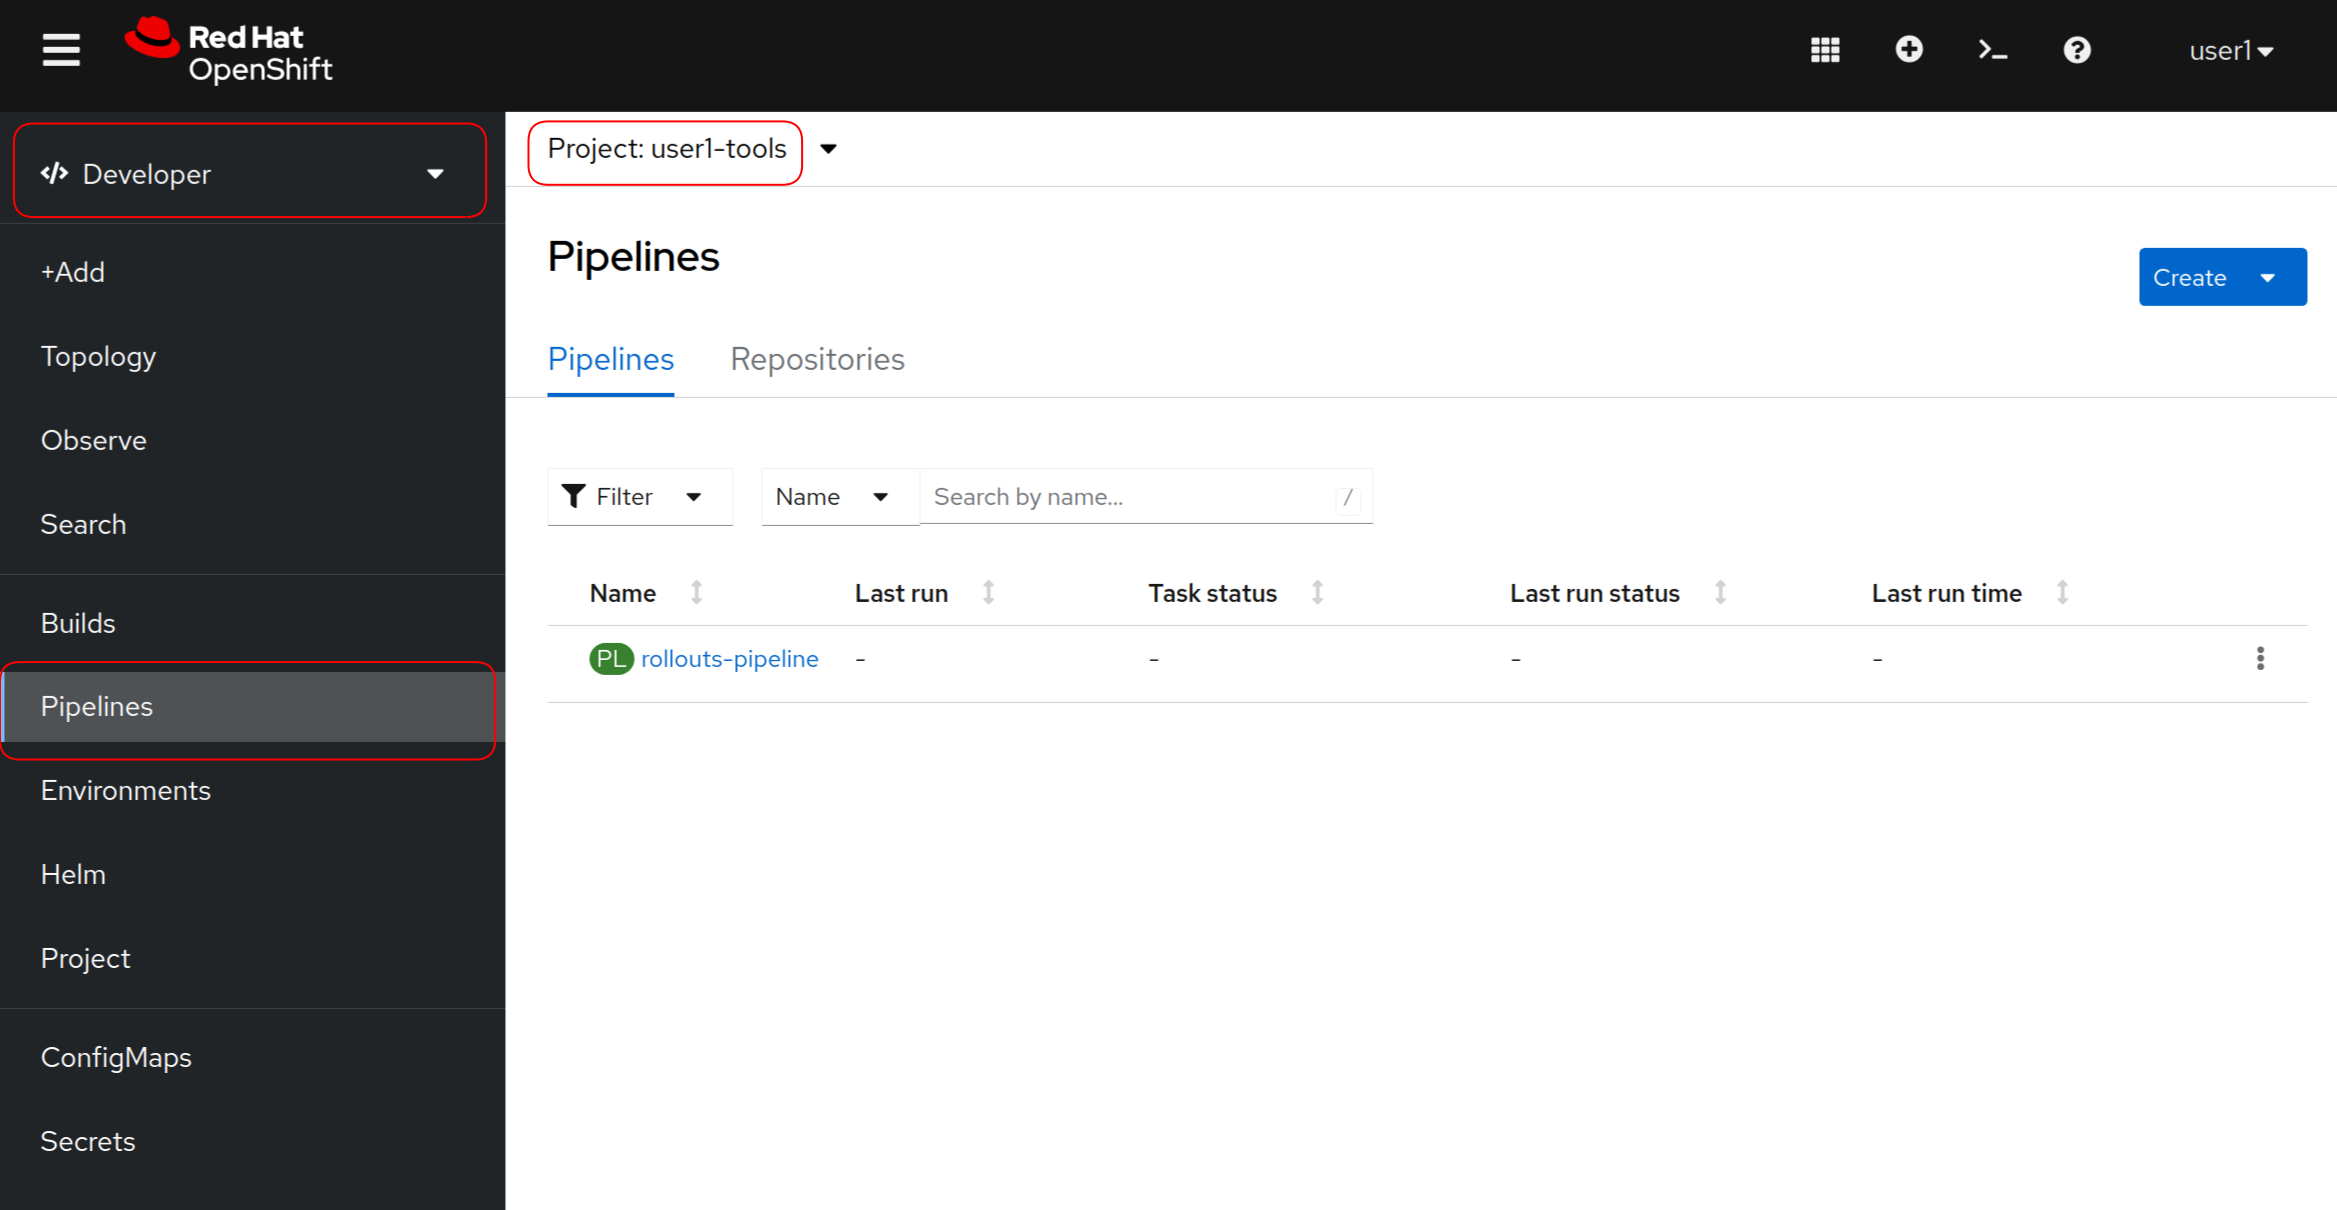
With the updated blue-green rollout deployed, let’s run through a promotion to a new image where
the analysis succeeds and observe the behavior. In the OpenShift console, go to the Pipelines
and do a promotion to a green image. As a reminder this is located here in the console:
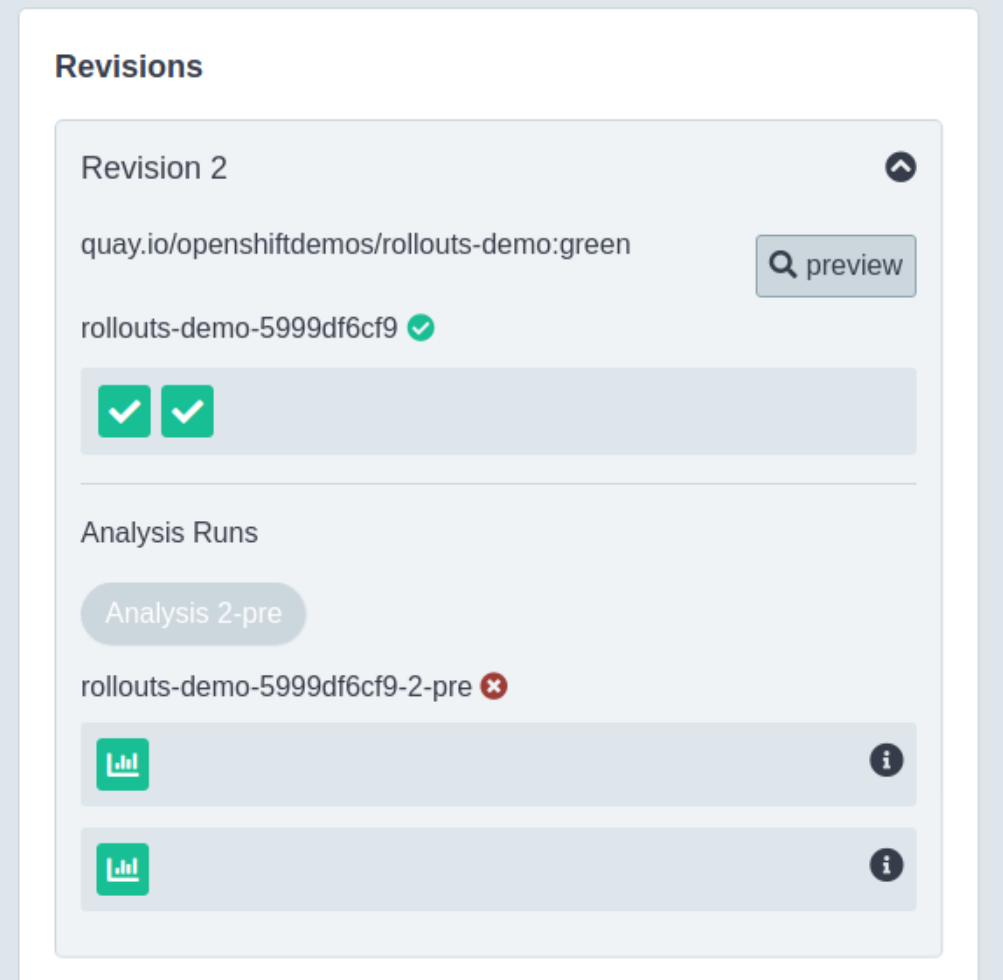
Wait for the pipelines to complete and then go to the Argo Rollouts dashboard where you may see the following if the Analysis is still running where the Analysis button is shown in grey (highlighted in the image with a red outline):
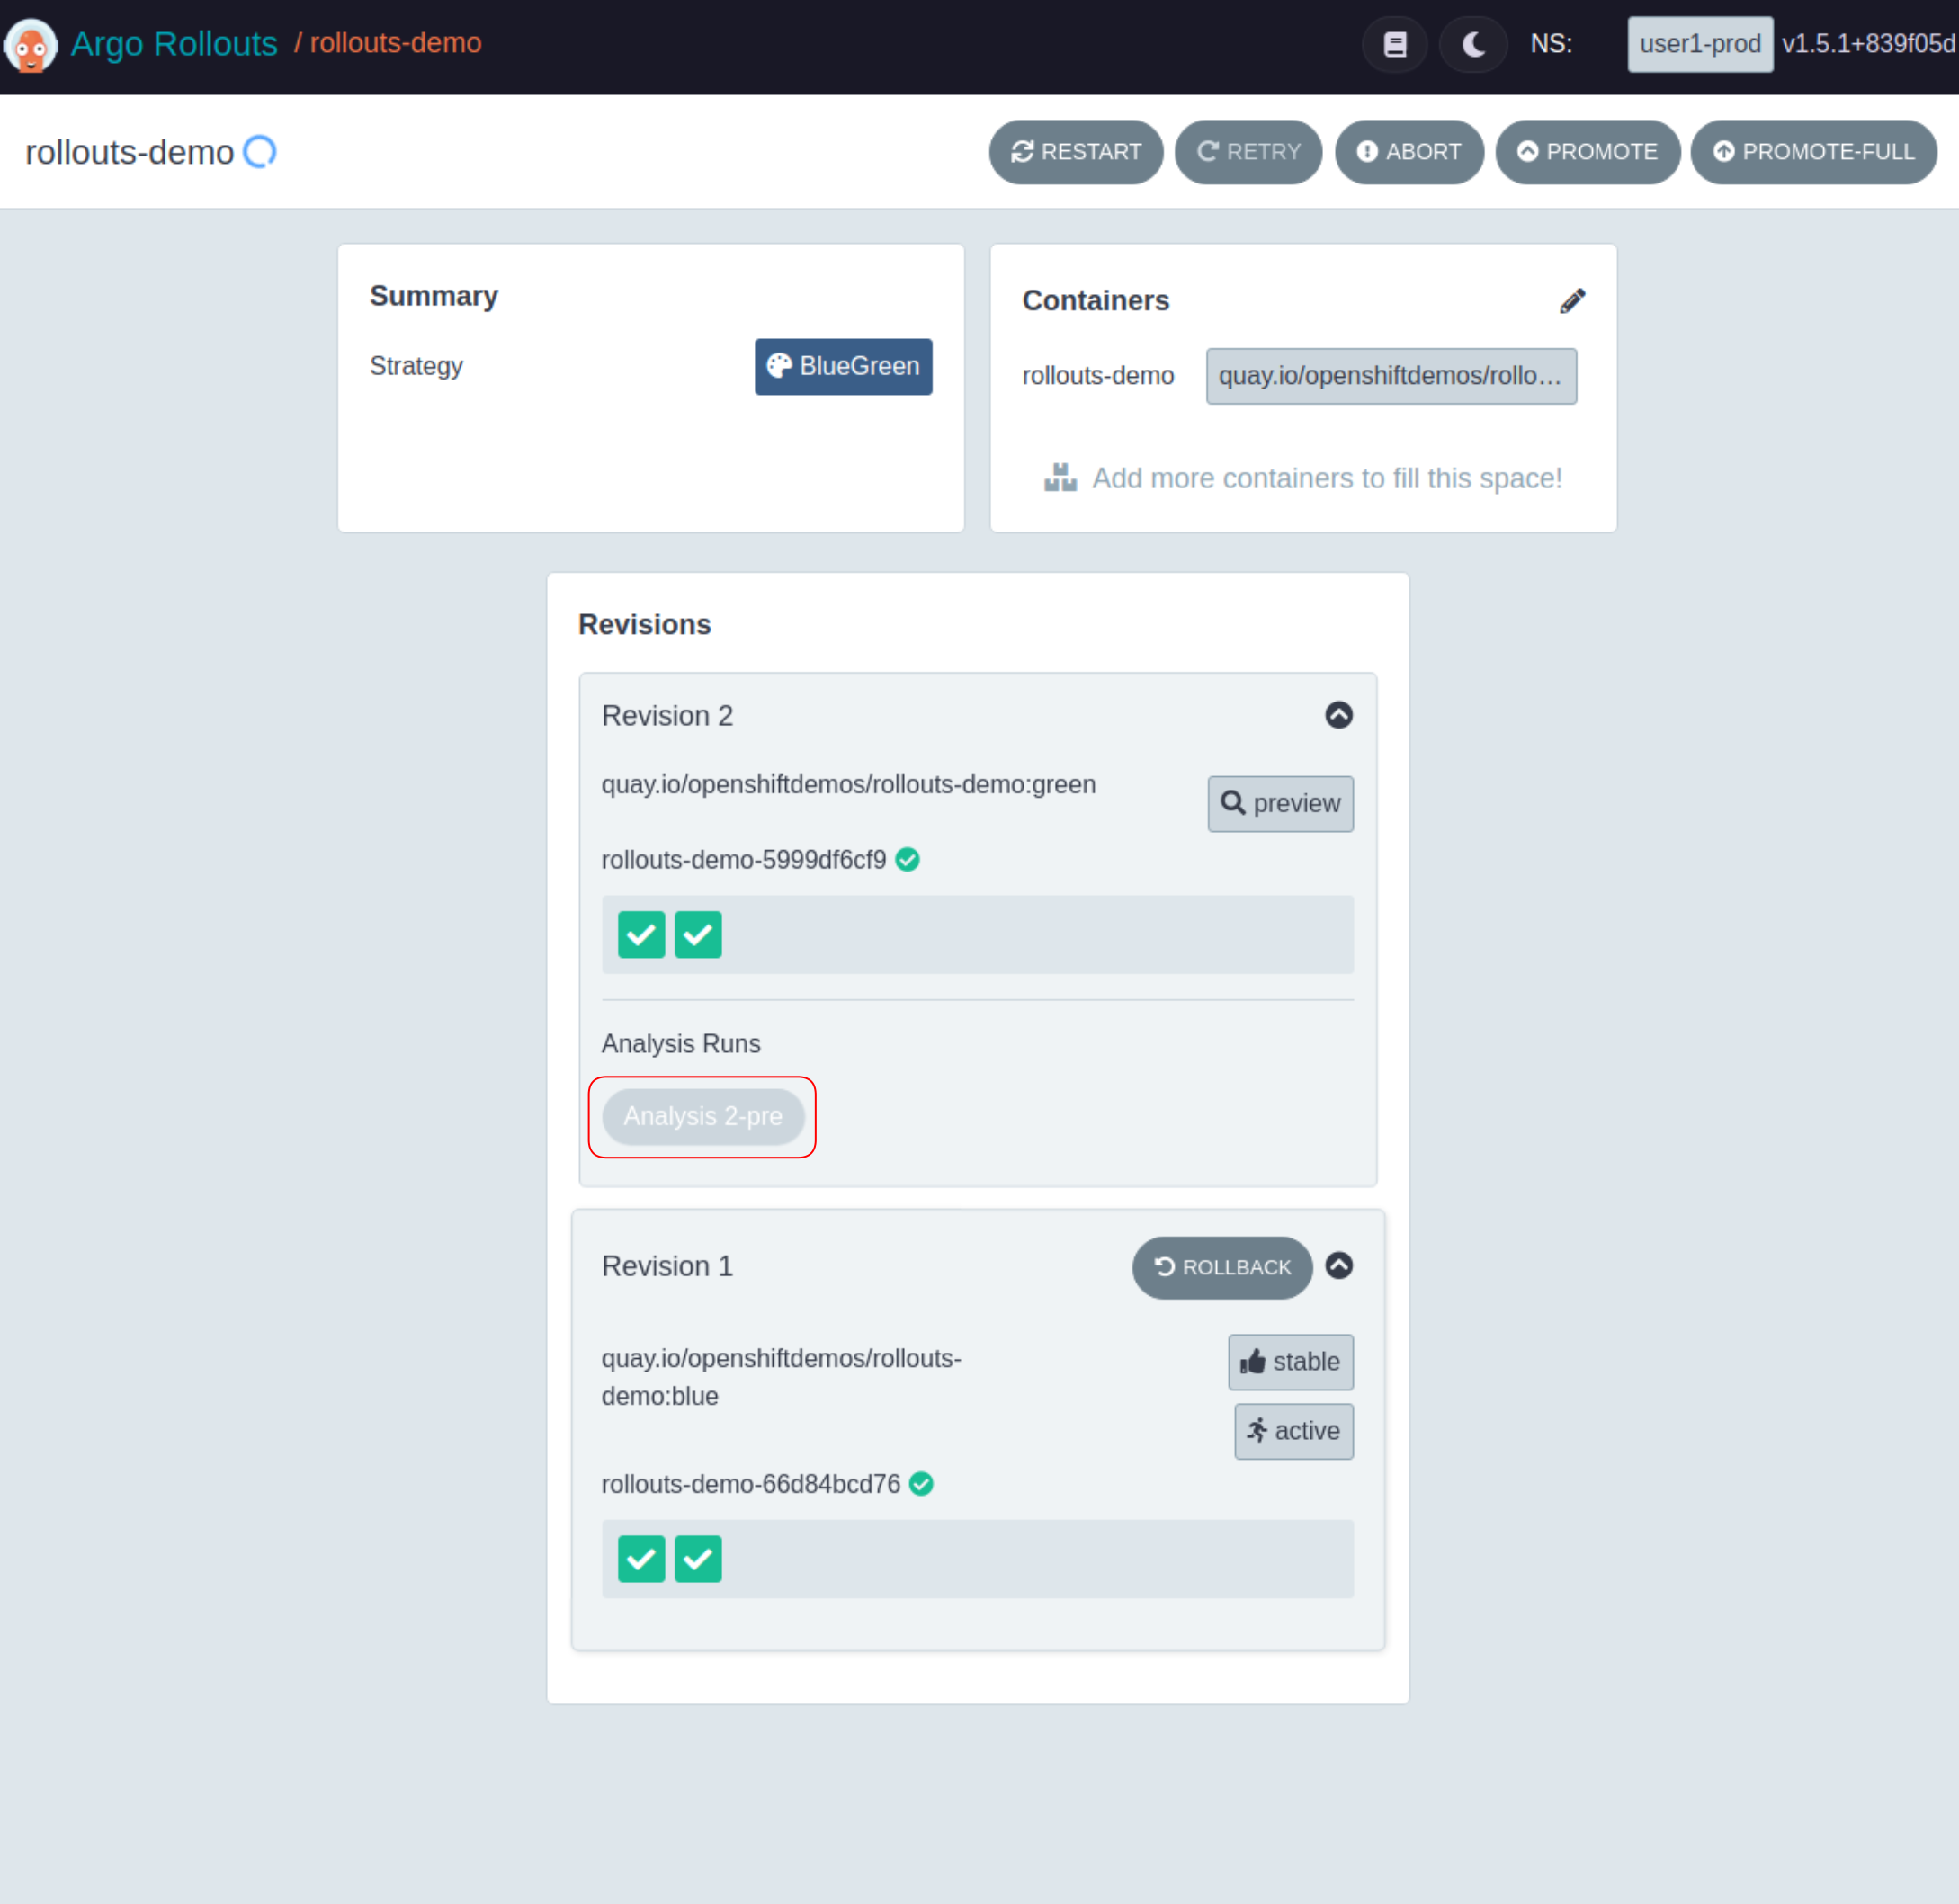
When a promotion of a rollout with an analysis is executed the controller will generate an analysis run for each template execution. Since we only have one template being used in pre-promotion we will only see one analysis run being created. It is however possible for a promotion to have multiple analysis runs, dependent on the rollout configuration. i.e. in blue-green defining both pre and post promotion analysis.
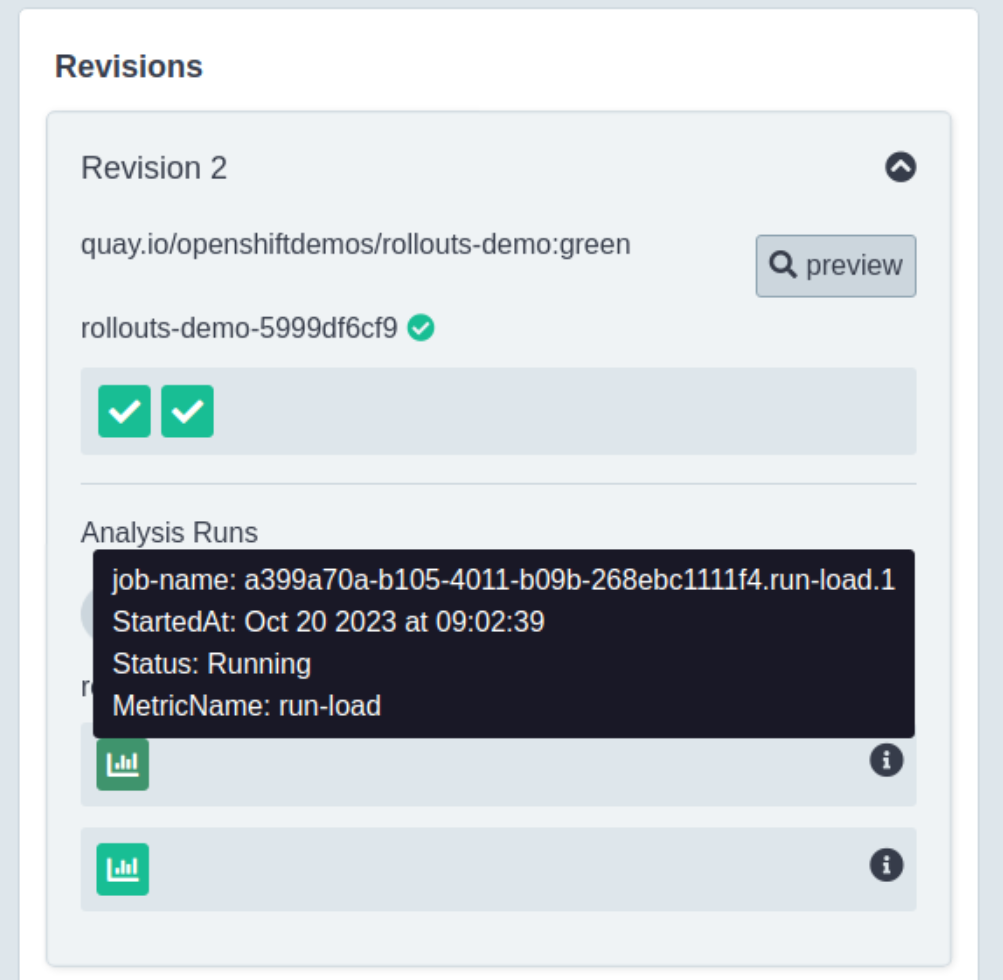
Clicking on the analysis button will expand the view to show the in-progress analysis that is running:
Note there are two green boxes with graph icons that are being shown in separate rows. Each row represents a provider and if you recall we had two providers, the job running Siege and the metric provider. Hovering the mouse over the buttons will display additional information:
Once the analysis is complete the Analysis button will go green to show that it successfully completed:
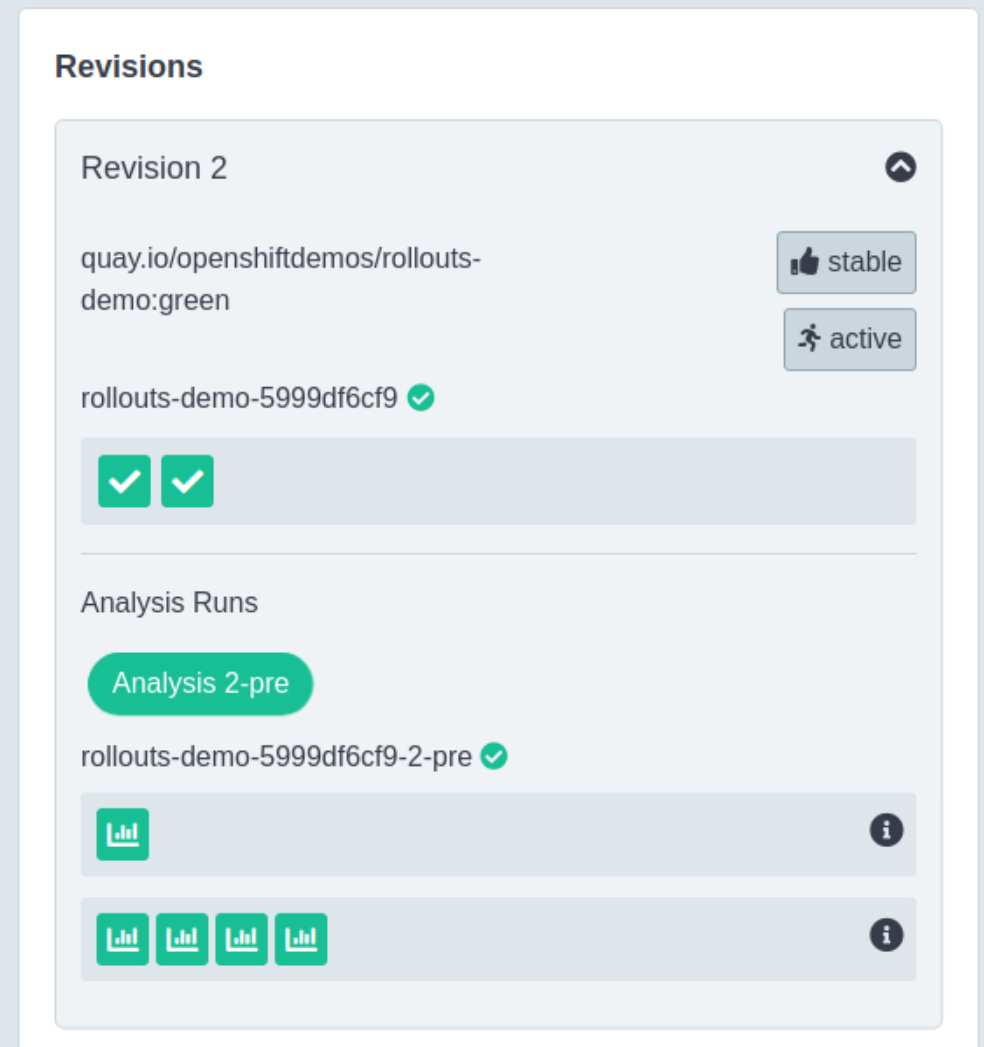
Notice that one row has four graph icons, this represents the four measurements that were taken during the execution of the AnalysisRun. Hovering the mouse over any of these graph icons will show you the measurement result.
| You may need to refresh the browser to see new metrics being added to the AnalysisRun depending on connectivity during the workshop. |
You can also use the Argo Rollouts CLI to examine the status of the Rollout by executing the get
command that we used earlier:
oc argo rollouts get rollout rollouts-demo -n USER_PLACEHOLDER-prodThis will display output similar to the following assuming the analysis run has completed executing:
Name:            rollouts-demo
Namespace:       USER_PLACEHOLDER-prod
Status:          ✔ Healthy
Strategy:        BlueGreen
Images:          quay.io/openshiftdemos/rollouts-demo:green (stable, active)
Replicas:
  Desired:       2
  Current:       2
  Updated:       2
  Ready:         2
  Available:     2

NAME                                                        KIND         STATUS         AGE    INFO
⟳ rollouts-demo                                             Rollout      ✔ Healthy      6m58s
├──# revision:2
│  ├──⧉ rollouts-demo-5999df6cf9                            ReplicaSet   ✔ Healthy      2m23s  stable,active
│  │  ├──□ rollouts-demo-5999df6cf9-cw5bm                   Pod          ✔ Running      2m23s  ready:1/1
│  │  └──□ rollouts-demo-5999df6cf9-rfgzr                   Pod          ✔ Running      2m23s  ready:1/1
│  └──α rollouts-demo-5999df6cf9-2-pre                      AnalysisRun  ✔ Successful   2m20s  ✔ 5
│     └──⊞ 17525abd-96e7-4abe-bac3-e9f62249a353.run-load.1  Job          ✔ Successful   2m20s
└──# revision:1
   └──⧉ rollouts-demo-66d84bcd76                            ReplicaSet   • ScaledDown   6m58s
      ├──□ rollouts-demo-66d84bcd76-95xh8                   Pod          ◌ Terminating  6m58s  ready:1/1
      └──□ rollouts-demo-66d84bcd76-qq8lt                   Pod          ◌ Terminating  6m58s  ready:1/1
Note for the new revision the results of the AnalysisRun is shown with the INFO column showing a checkmark with a 5. The five shows the aggregated total of four measurement checks plus the job executing successfully for a total of five.
Analysis Fails
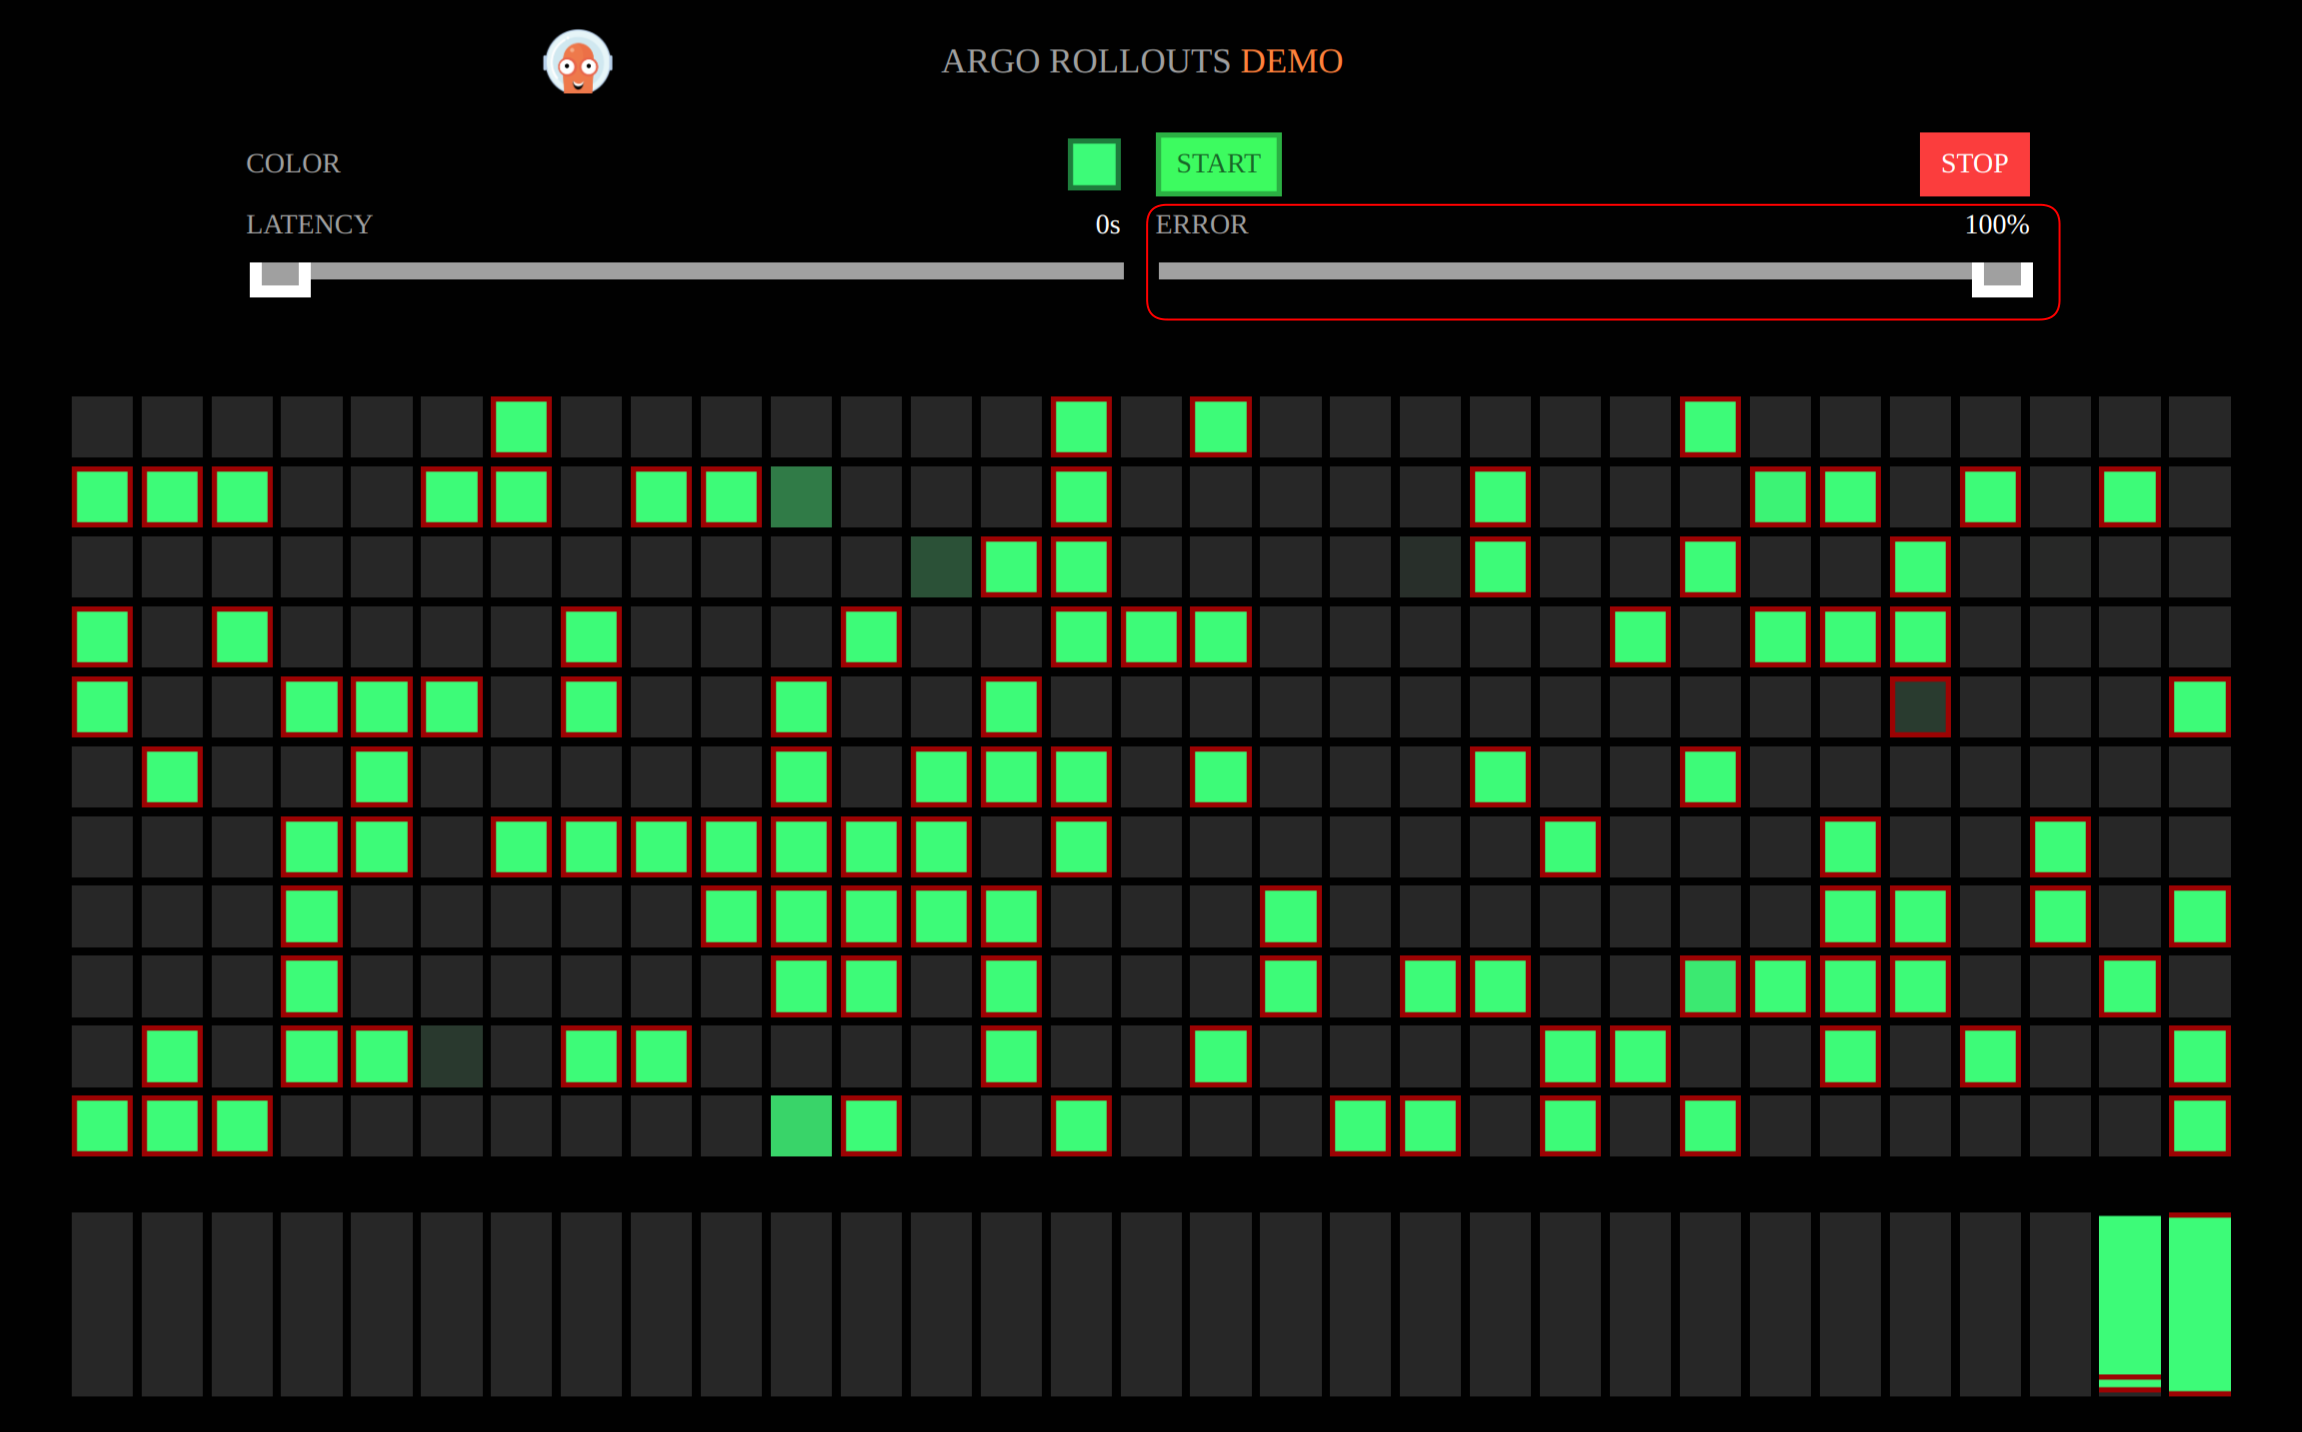
Now that we have experienced a successful promotion, let’s examine the behavior when the application has errors and the analysis fails. To start, open the preview version of the application.
Slide the error bar as shown below all the way to the right. Notice how all of the flashing squares have red outlines around them indicating they are returning error messages.
| This section should not be overly timing sensitive since we are cheating a bit by pre-generating errors. However when we promote the new image the error setting will be reset back to 0 for the preview service. After the promotion pipeline completes, immediately switch back to the tab with the preview service and push the error bar back to 100%. |
Now we will perform a promotion to a yellow image, go back to the OpenShift Pipeline and start it with the yellow image:
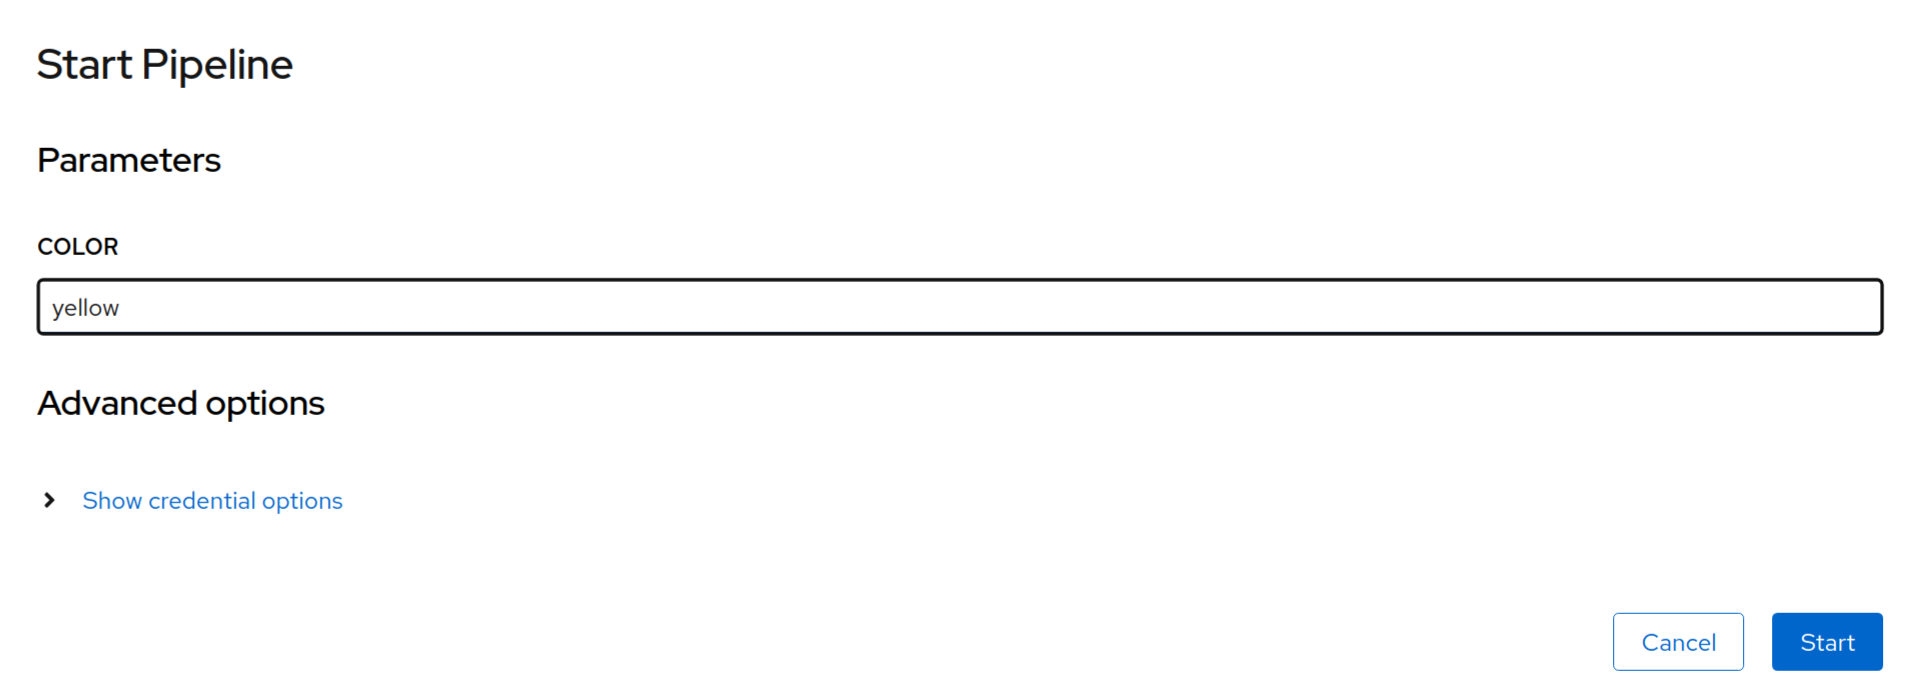
As mentioned in the note above, once the pipeline is finished you must immediately switch back to the preview service and set the error rate to 100%.
If you did everything correctly, you should see that the Analysis failed as indicated by the red button:
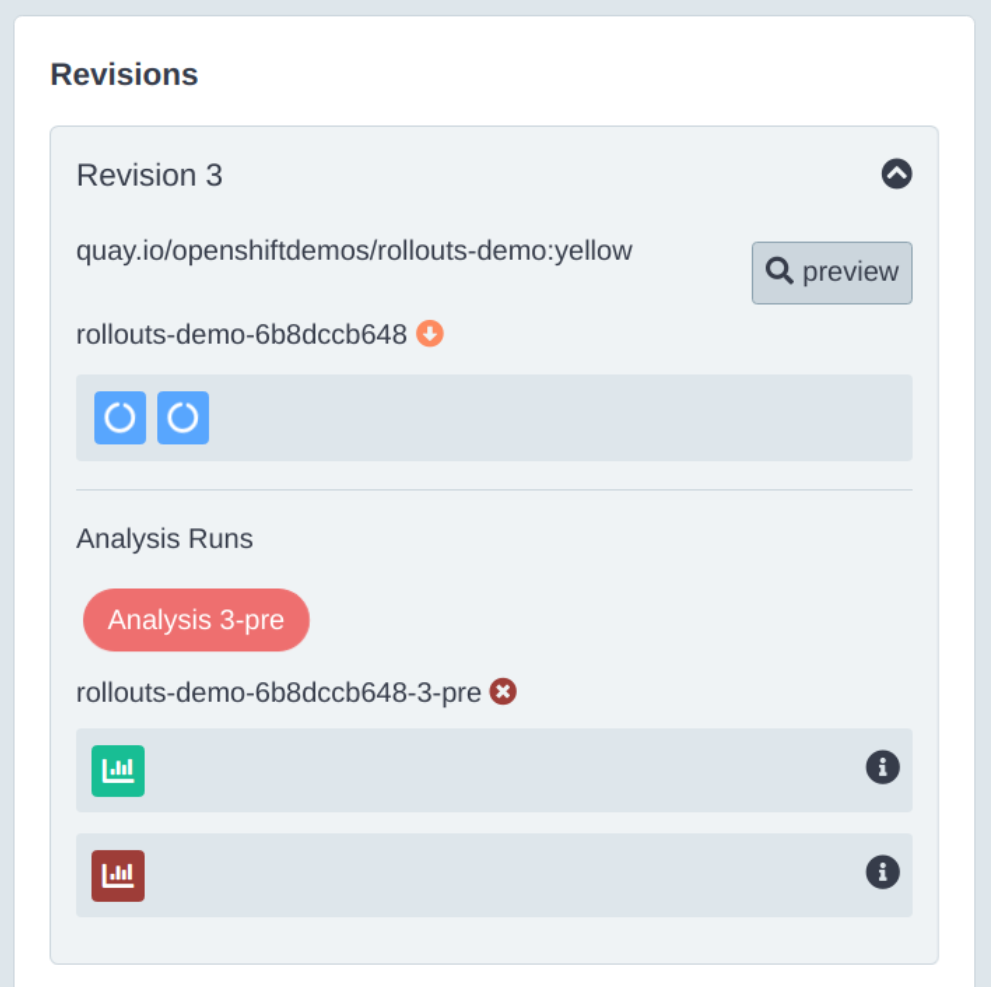
| If the timing did not work out for you, you can try again by promoting with a different color. You can see the list of available colors here where each color is simply a tag in our quay.io registry. |
If you expand the Analysis section, you will see at least one metric test has failed as pictured above. You can hover the mouse over the failed analysis to see the details.
Examining the rollout with the CLI using the previous get command:
oc argo rollouts get rollout rollouts-demo -n USER_PLACEHOLDER-prodWill now show the following:
Name:            rollouts-demo
Namespace:       USER_PLACEHOLDER-prod
Status:          ✖ Degraded
Message:         RolloutAborted: Rollout aborted update to revision 3: Metric "success-rate" assessed Failed due to failed (1) > failureLimit (0)
Strategy:        BlueGreen
Images:          quay.io/openshiftdemos/rollouts-demo:green (stable, active)
Replicas:
  Desired:       2
  Current:       2
  Updated:       0
  Ready:         2
  Available:     2

NAME                                                        KIND         STATUS        AGE    INFO
⟳ rollouts-demo                                             Rollout      ✖ Degraded    23m
├──# revision:3
│  ├──⧉ rollouts-demo-6b8dccb648                            ReplicaSet   • ScaledDown  8m46s  preview,delay:passed
│  └──α rollouts-demo-6b8dccb648-3-pre                      AnalysisRun  ✖ Failed      8m43s  ✔ 1,✖ 1
│     └──⊞ d484ff69-4ef1-4cf1-9a10-1b78530dadc7.run-load.1  Job          ✔ Successful  8m43s
├──# revision:2
│  ├──⧉ rollouts-demo-5999df6cf9                            ReplicaSet   ✔ Healthy     18m    stable,active
│  │  ├──□ rollouts-demo-5999df6cf9-cw5bm                   Pod          ✔ Running     18m    ready:1/1
│  │  └──□ rollouts-demo-5999df6cf9-rfgzr                   Pod          ✔ Running     18m    ready:1/1
│  └──α rollouts-demo-5999df6cf9-2-pre                      AnalysisRun  ✔ Successful  18m    ✔ 5
│     └──⊞ 17525abd-96e7-4abe-bac3-e9f62249a353.run-load.1  Job          ✔ Successful  18m
└──# revision:1
   └──⧉ rollouts-demo-66d84bcd76                            ReplicaSet   • ScaledDown  23m
Clean-up
Prior to moving on to the next module we need to perform some clean-up activities. First let’s reset the Development environment back to blue:
oc apply -k ./deploy/base -n USER_PLACEHOLDER-devNext we will delete the Rollout in the USER_PLACEHOLDER-prod so we can start fresh as we explore the canary strategy next.
kustomize build ./bluegreen-analysis/base | sed "s/%SUB_DOMAIN%/OPENSHIFT_CLUSTER_INGRESS_DOMAIN_PLACEHOLDER/" | sed "s/%USER%/USER_PLACEHOLDER/" | oc delete -n USER_PLACEHOLDER-prod -f -